Events
Events is the alert queue: the list of things that have actually happened to vehicles and need a person to look at them. Each row is one occurrence — one rule that matched one vehicle at one moment, or one finding about a vehicle's legality, or one problem with IFMS's own connections. Operators work down this queue, take ownership of each item and close it when it has been dealt with.
The page describes itself as "Violation and activity events across the monitored fleet — review, acknowledge and resolve."
The sidebar has two similar-sounding entries and they are not the same thing. Events (under Management) is this screen: the things that happened. Alert Policies (under Configuration) holds the rules that produce them. Elsewhere in the portal these same rows are called alerts — the banner says "critical alerts", the count card hint says "All alerts on record", and the dialogs say "Acknowledge alert" and "Resolve alert" in the same breath. This manual calls a rule a policy and one of these rows an alert, and quotes the screen wording wherever you need it to find something. See Key concepts.
Only legal vehicles are shown in vehicle filters. Alerts for hidden vehicles are hidden from the list and summary, except Legality violations. To find those, change Alert kind from Rule events to Legality violations.
Who can see this screen
Anyone whose role allows them to read alerts: Operator, Supervisor, Operational manager and System admin. All four of those roles can also acknowledge and close alerts.
If your role does not include it, the Events item is missing from the sidebar, and opening the address directly shows "Access denied" — "You don't have permission to view this page. If you think this is a mistake, contact your administrator." — with a Back to overview button. See What each role can do.
How to open it
- In the sidebar, under Management, select Events (the siren icon).
Three other things bring you here:
- Selecting an alert in your Inbox, or under the notifications bell, opens Events with that alert's detail panel already open — even if the alert is not on the page of results you would otherwise be looking at.
- The Recent events card on a provider's page opens Events with the Provider filter already set to that company.
- A link can also open Events with the Vehicle filter already set, although no screen in the portal builds one.
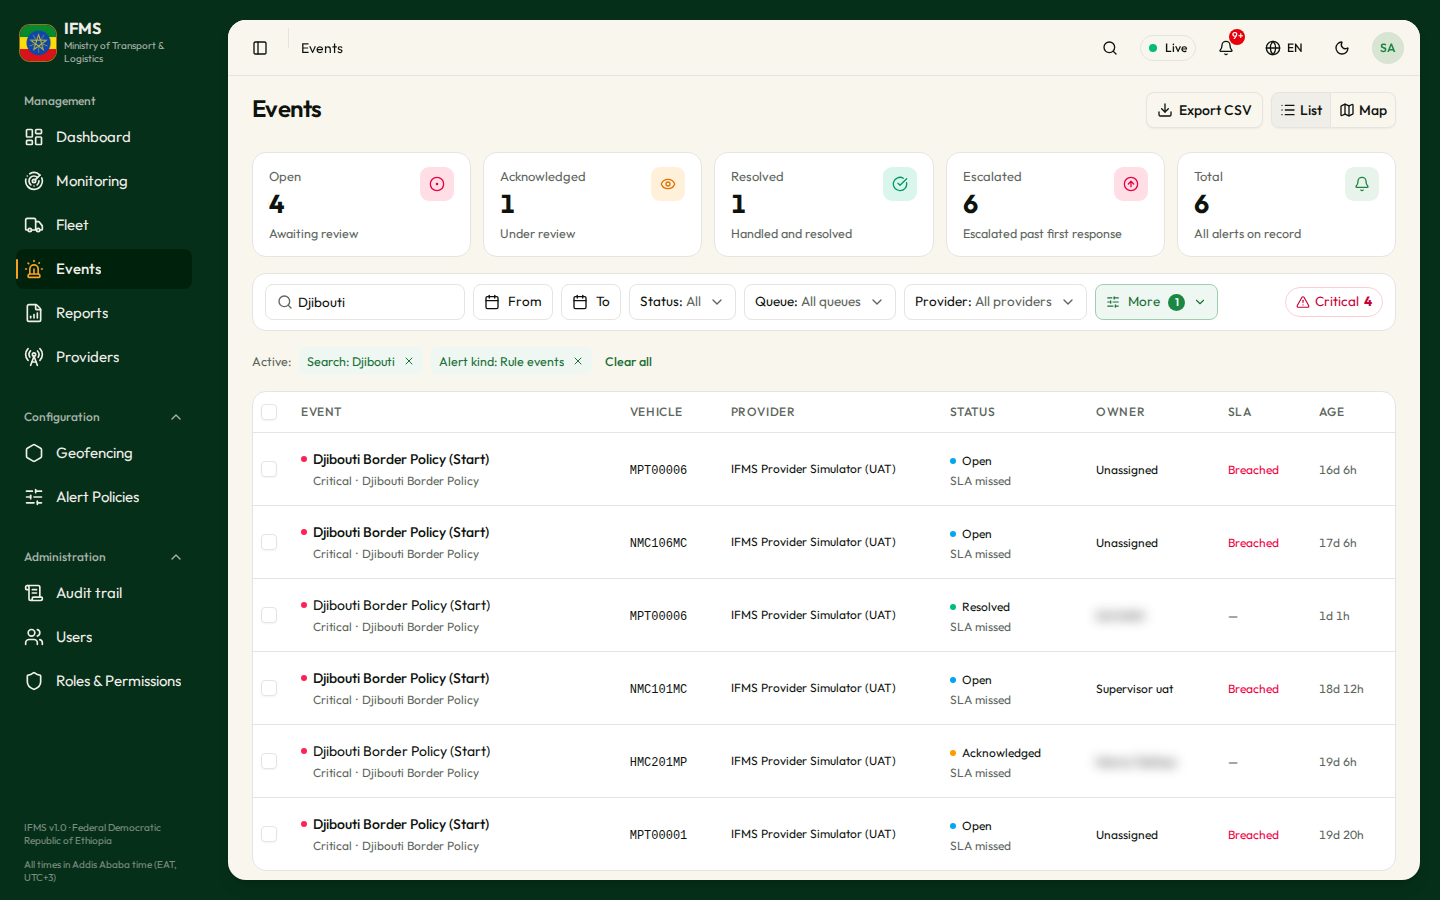
The screen has six regions, top to bottom:
- the page title and description, with Export CSV and the List / Map toggle on the right;
- the red critical alerts banner, when there is something to say;
- five count cards;
- the row of seven filters;
- the list of alerts (or the map, if you switch the toggle);
- the detail panel, which slides in from the right when you select a row.
Nothing on this page updates on its own. New alerts appear only when you change a filter, turn a page, leave the screen and come back, or reload it. The empty message says "wait for the live feed", but waiting will not bring anything in. Treat the queue as a snapshot and re-open the screen regularly.
The critical alerts banner

A rose-red bar with a pulsing dot appears above the count cards when at least one alert in the list in front of you is still Open and shows the Critical badge. It reads "1 critical alert needs attention" or "4 critical alerts need attention".
| Control | What it does |
|---|---|
| Review | Sets Severity to Critical and Status to Open, switches to the list, and goes back to page one. |
| X (Dismiss) | Hides the banner. It comes back when you reload the page or leave and return; the dismissal is not remembered. |
The banner counts only the alerts on the page you are looking at (ten by default), and the Critical badge on a row covers both High and Critical severities. Review, though, filters to Critical alone. So the banner can say "3 critical alerts" and Review can leave you with one row, or none. Nothing has gone missing — the High ones are still there under Severity: High.
The count cards

| Card | What it counts | Hint under the number |
|---|---|---|
| Open | Alerts nobody has picked up yet. The number turns red when it is above zero. | "Awaiting review" |
| Acknowledged | Alerts somebody has taken ownership of but not yet closed. | "Under review" |
| Resolved | Alerts that have been closed. | "Handled and closed" |
| Escalated | Alerts that passed their response window while still open and were escalated automatically. | "Escalated past first response" |
| Total | Every alert IFMS has ever raised. | "All alerts on record" |
The cards count every alert of every kind, ever, and take no notice of the filters. The list, by contrast, starts out showing only Rule events. So the Open card can read 40 while the table below shows 3 rows, with no error anywhere. Two more differences to know about:
- the Escalated card includes alerts that have since been closed, so it is a historical count, not a queue;
- Open + Acknowledged + Resolved equals Total, but none of those four numbers relates to what the filters are set to.
The counts are also cached for about half a minute, so they can lag the list by a few seconds after you acknowledge or close something.
The filters
The filters sit in one row above the list. Every one of them is applied by IFMS itself, not in your browser, and changing any of them takes you back to page one. Each list starts with its own "All …" option, which clears it.
| Filter | Shows when cleared | Options |
|---|---|---|
| Alert kind | "All alert kinds" | Rule events, Legality violations, Integration health |
| Status | "All statuses" | Open, Acknowledged, Resolved |
| Type | "All types" | Speeding, Geofence, Ignition, Idle / distance |
| Severity | "All severities" | Info, Low, Medium, High, Critical |
| Provider | "All providers" | One entry per GPS provider known to IFMS |
| Escalation | "All alerts" | Escalated only, Not escalated |
| Vehicle | "All vehicles" | One entry per legal vehicle, listed by plate |
The raised dates
After the search box, From and To limit the list to alerts raised between two days. Both start empty, which means any date.
- Select From and pick the first day. The month and year menus at the top of the calendar move to another month quickly; days after today are greyed out.
- Select To and pick the last day.
The list covers the whole of both days, from midnight at the start of From to midnight at the end of To, Addis Ababa time. You can set just one of them. A Raised chip under the filters shows the days, for example 3–9 Nov; select its ✕ to clear both. The ✕ after each day clears that day alone.
Links from the Dashboard open Events on the Dashboard's dates.
Alert kind: the one filter that is not cleared to start with
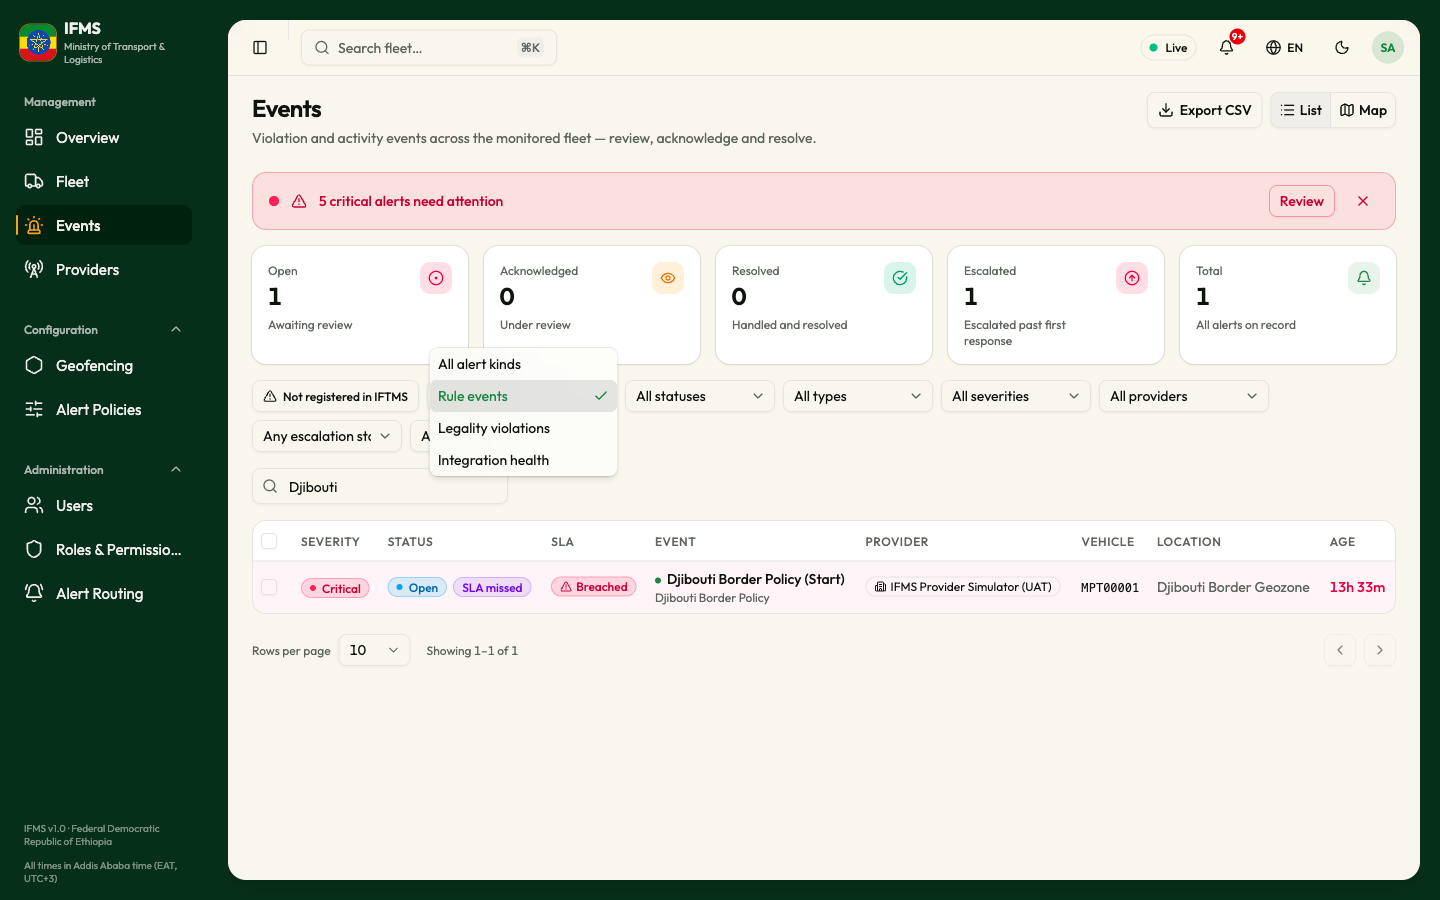
Alert kind separates the three sorts of alert IFMS raises.
| Option | What it contains |
|---|---|
| Rule events | Alerts raised by your alert policies from live position reports — a vehicle entered a zone, went over a speed limit, idled too long. This is the only kind that has a Type. |
| Legality violations | Raised once when a legal vehicle stops being legal. Always Critical. Kept in Events after the vehicle is hidden, without a vehicle link. |
| Integration health | Raised when IFMS itself cannot get an authoritative answer — the decision store is unreachable or out of date, a lookup was refused, a delivery was rejected. Always High. This is never a finding about a vehicle. |
When you open Events, Alert kind is already set to Rule events, not to "All alert kinds". Legality violations and integration-health alerts are therefore hidden until you change it — while still being counted on the cards above. If the queue looks emptier than the Open card suggests, set Alert kind to All alert kinds first.
Choosing anything other than Rule events or All alert kinds also hides the Type filter and clears it, because only rule events have a type.
Type
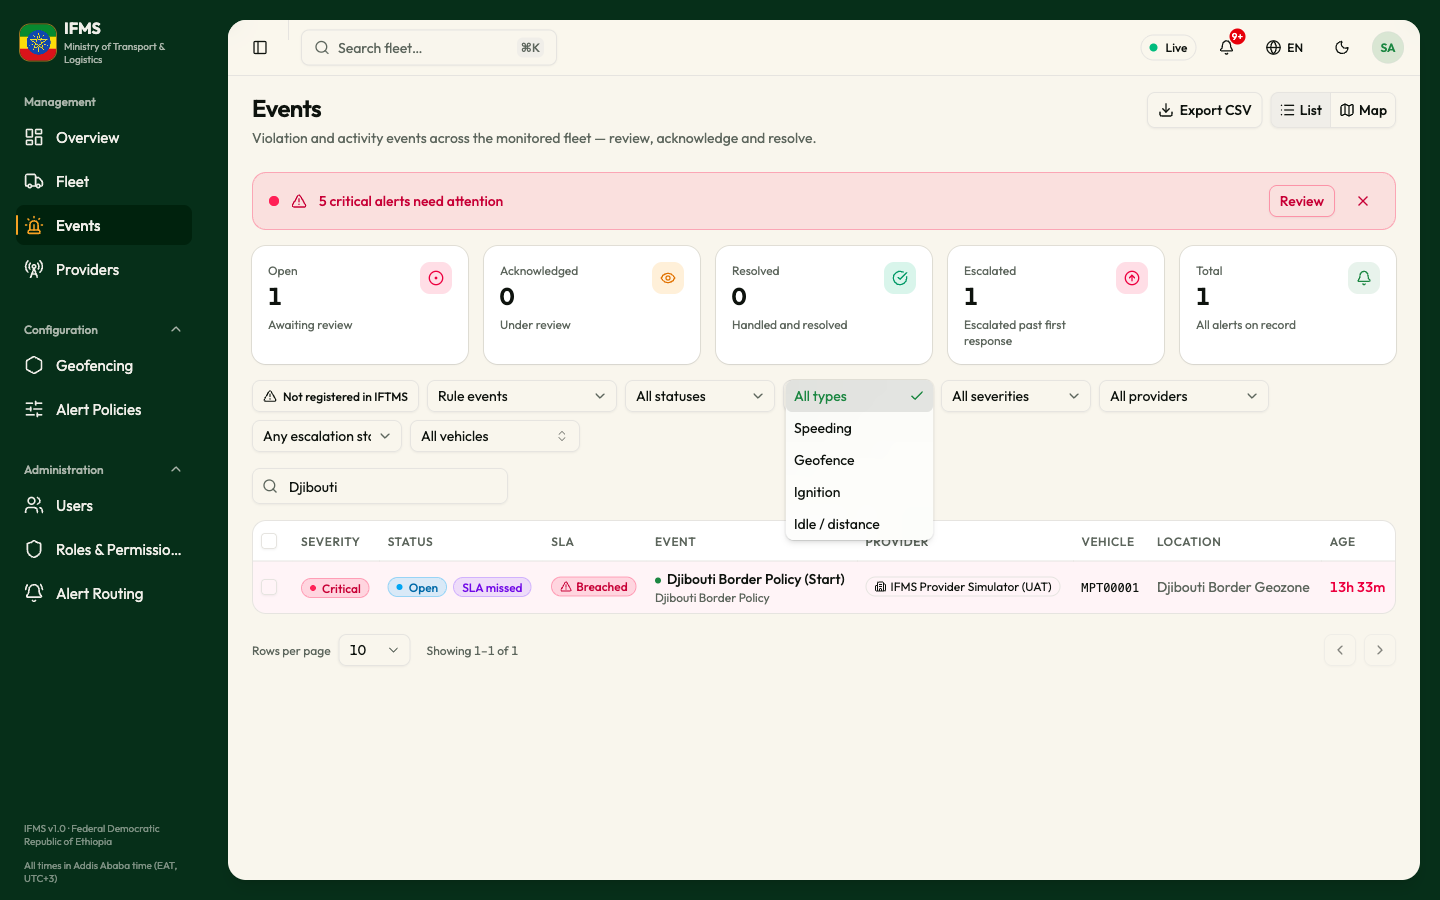
Type narrows rule events to one kind of condition.
A policy with several conditions — say Geofence and Speed over 40 — files every alert it raises under the first condition in its list. An alert about speeding inside a zone will normally be filed as Geofence, because that is how the policy was written. If you cannot find an alert by Type, clear the filter and search instead.
Severity
Alert rows show only three severity badges, while the filter offers five levels. The table below is worth memorising, because it explains most of the surprises on this screen.
| Filter you choose | Badge on the row |
|---|---|
| Critical | Critical (rose) |
| High | Critical (rose) |
| Medium | Warning (amber) |
| Low | Info (sky blue) |
| Info | Info (sky blue) |
| (no severity set on the policy) | Info (sky blue) |
So a row badged Critical may be either a High or a Critical alert, and the two behave differently: they have different response windows (Response times and escalation), and the banner's Review button only picks up the Critical ones.
Escalation
Escalated only shows alerts that passed their response window while still open and were escalated. Not escalated shows the rest. The cleared option is labelled All alerts, which means "in any escalation state" and not "every alert on the system".
Provider and Vehicle
Provider lists every GPS company that has ever delivered to IFMS. Vehicle lists legal vehicles by plate; it has no type-to-search box inside it, so on a large fleet it is quicker to use the search box below.
The search box
Above the table on the left is a box marked Search events. The search runs shortly after you stop typing and matches, ignoring capitals, any part of:
- the alert's message text;
- the vehicle's plate;
- the name of the policy that raised it.
Because the message of a rule event is built from the policy name — for example "Galafi border crossing entry (Start)" — searching for a policy name is the quickest way to see everything one rule has produced.
The search box is not shown on the map, but whatever you typed stays applied when you switch to it.
The list
Column headings are shown in capitals.
| Column | What it shows |
|---|---|
| SEVERITY | Info, Warning or Critical, as in the table above. |
| STATUS | Open (sky blue), Acknowledged (amber) or Closed (green), plus a violet L1 badge when the alert has been escalated. |
| SLA | Breached in a red badge with a warning triangle when the alert has passed its response window, otherwise "—". See Response times and escalation. |
| EVENT | The alert's message on the first line, and the kind of event underneath in small grey text. Rows nobody has picked up yet carry a small blue dot and heavier text, like an unread message. |
| PROVIDER | The GPS company that reported the vehicle, or "—". |
| VEHICLE | The plate. A vehicle with no plate on file shows # and its record number; an alert with no vehicle at all shows "—". |
| LOCATION | The name of the geozone the policy watches, or "—". |
| AGE | How long ago the alert was raised — "7m", "3h 20m", "2d 4h". Point at it to see the exact date and time. The text turns red when the response window has been missed. |
The LOCATION column shows the geozone named in the policy, not the place the vehicle actually was. An alert from a policy with no geozone — most speeding, ignition and idling policies, and every legality or integration-health alert — shows "—" here. To find out where the vehicle was, open the alert, follow the plate through to the vehicle's page and read its position and history there.
What the EVENT column says
The small grey second line names the kind of event:
| Line 2 | What raised it |
|---|---|
| Speeding | A speed condition |
| Geozone entry | A geofence condition, on the way in |
| Geozone exit | A geofence condition, on the way out |
| Excessive idling | An idle condition |
| Ignition state | An ignition condition |
| Legality violation | A vehicle that was legal stopped being legal. The Critical alert stays here without a vehicle link |
| Integration health | IFMS could not get an authoritative answer |
The message on the first line depends on the kind:
- Rule events read "<policy name> (Start)" or "<policy name> (End)", so the message tells you which policy fired and at which edge.
- Legality violations read "Vehicle lost legal status:" followed by the plate. Older legality alerts read "Register says this vehicle is not legal to operate:" followed by the reason codes.
- Integration health alerts read "IFMS cannot currently decide vehicle legality:" followed by a description of the failure.
The grey second line always shows the type of event, never the name of the policy, and the detail panel's Rule line is never filled in. If you need to know which rule raised an alert, read the message on the first line: the policy name is the part before "(Start)" or "(End)".
Colour on the rows
- A red left edge and a pale red background mean the alert is past its response window, or is an open Critical one.
- A faint red left edge means a Critical alert that has been acknowledged.
- Closed alerts carry no colour at all.
Order and selecting a row
The newest alert is always first, and the columns cannot be sorted. Selecting a row anywhere opens that alert's detail panel: see Handle an alert.
Moving through the pages

Under the table:
- Rows per page — 10 (the default), 20, 50 or 100.
- Showing 1–10 of 43 — which rows you are looking at and how many match the filters.
- The < and > arrows move one page back or forward.
The footer disappears when nothing matches. If you tighten a filter while you are deep in the results, IFMS moves you back to the last page that still exists.
The rows-per-page setting matters more here than on other screens, because both the map and Export CSV work on the page in front of you and nothing else.
The map
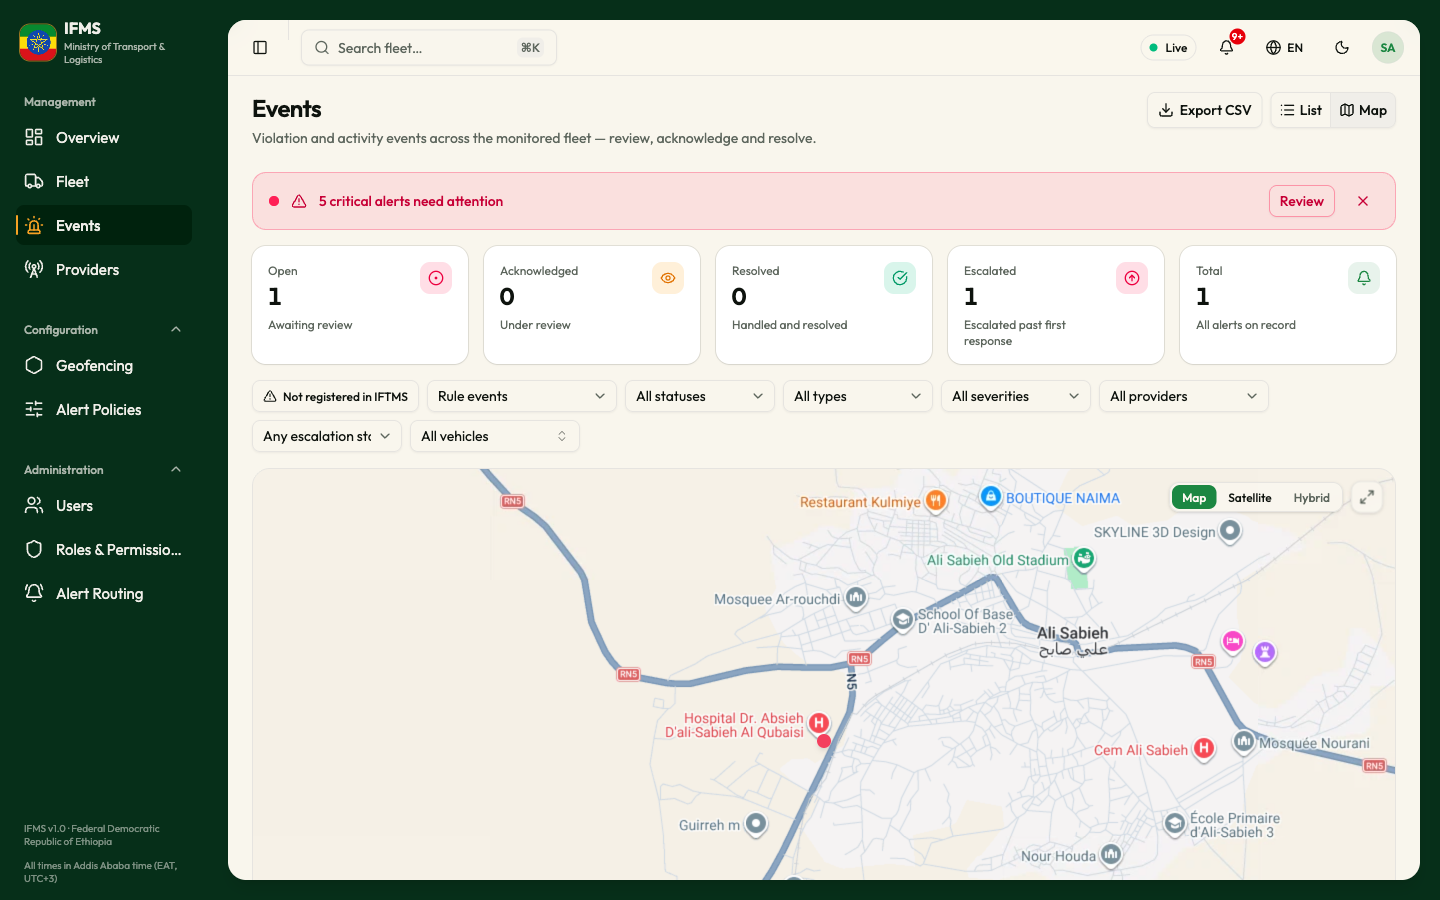
The Map button at the top right (and List to come back) swaps the table for a map of the same alerts. The map zooms itself to fit the markers.
| Marker | Meaning |
|---|---|
| Sky-blue dot | An Info alert |
| Amber dot | A Warning alert |
| Rose dot with a pulsing halo | An open Critical alert |
| Faded dot | A closed alert |
| Larger dot with a ring | The alert whose detail panel is open |
Selecting a marker opens the alert's detail panel. There is no tooltip, legend or pop-up on the map, no search box and no page arrows.
A marker is drawn at the centre of the geozone the policy watches. Alerts with no geozone — speeding, ignition and idling policies without a zone, and integration-health alerts — are all drawn at the same fixed point over Addis Ababa. For a legality violation, read the last known position and position time in its detail panel. A large cluster at the fixed point means "alerts with no zone", not "a lot of trouble in Addis". The map also plots only the alerts on the current page, so with the default setting you are looking at ten markers at most; raise Rows per page in the list before switching over.
Exporting
Export CSV, at the top right, saves the alerts in front of you as a spreadsheet file. See Export the alert list.
When the screen is empty, loading or broken
| What you see | What it means | What to do |
|---|---|---|
| Six grey placeholder rows | The list is still loading. | Wait a moment. |
| Cards showing 0 while rows are listed | The counts are still loading. | Wait a moment; they fill in on their own. |
| "No events match" / "Adjust the filters or wait for the live feed." | Nothing matches the filters. | Clear the search box, set Alert kind to All alert kinds and the rest to their "All …" options. |
| A red message in the corner of the screen | A request failed. | The table falls back to "No events match" even though alerts exist. Reload the screen; if it keeps failing, tell your administrator. |
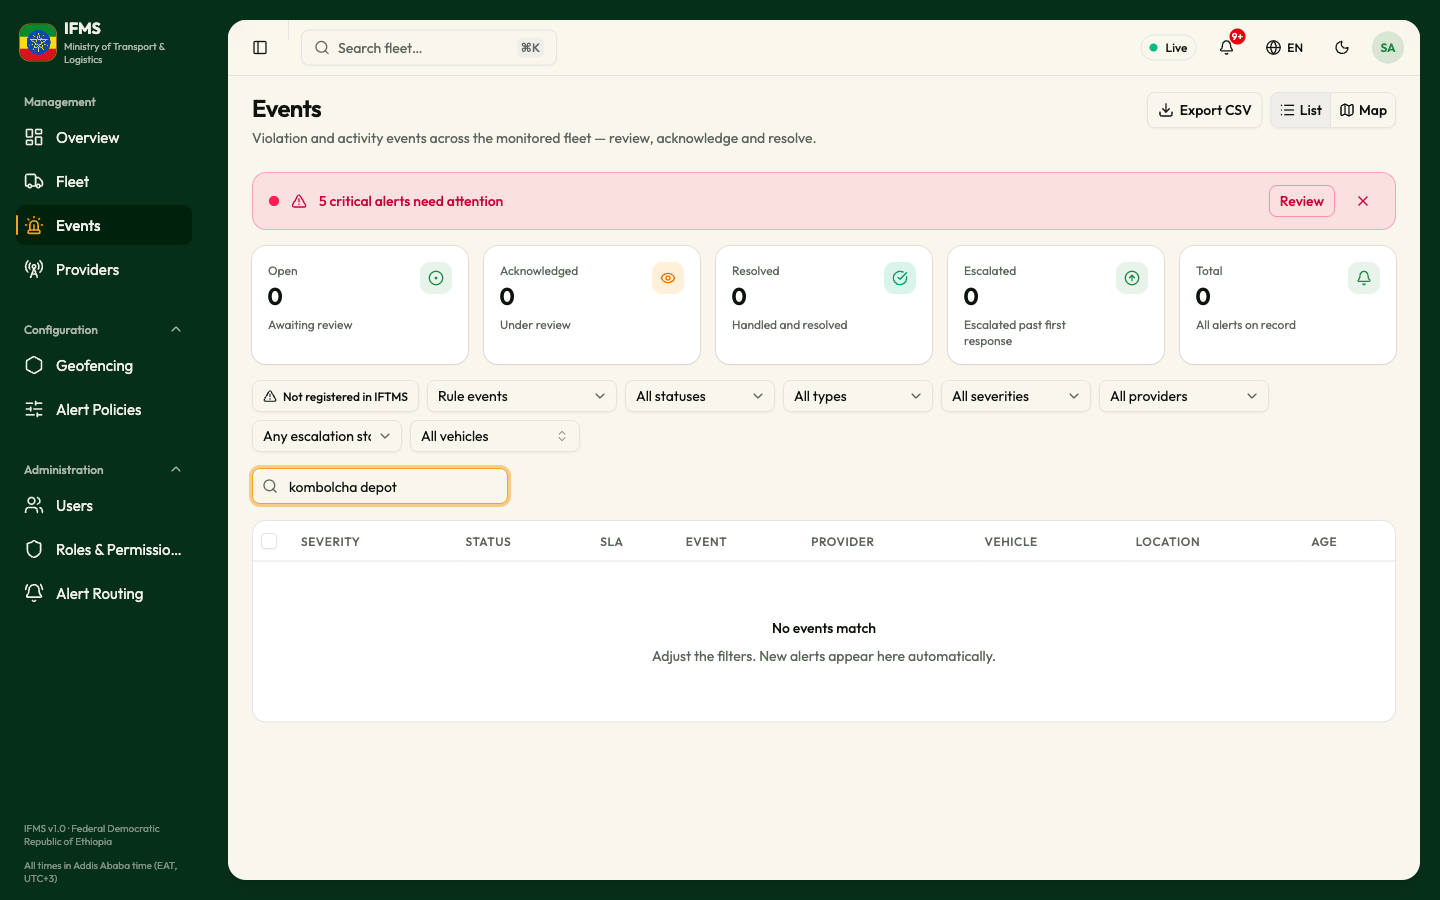
When a request fails, the table shows the same "No events match" message as a genuinely empty queue. An unexpectedly empty queue together with a red message in the corner is a failure, not good news.
Tips
- Start every shift with Alert kind: All alert kinds and Status: Open. That is the real work queue; the default view hides two of the three kinds.
- Set Rows per page to 50 or 100 before you use the map or Export CSV — both of them only ever cover the page in front of you.
- Escalation: Escalated only with Status: Open gives you the list of alerts nobody has picked up in time. It is the single most useful pair of filters on this screen.
- To see everything one policy has produced, type the policy's name into Search events.