Reports & Analytics
Reports & Analytics holds thirteen ready-made reports. Each one answers a question about the fleet — how far vehicles drove, which ones stopped reporting, which alerts were raised, which geozones were visited — as a table you can narrow down, sort and export to Excel, CSV or PDF.
The reports are built from the positions and alerts IFMS stores, and take in new data within a few minutes. The Dashboard draws its dated tiles from the same data.
Who can see this screen
Every Ministry role can open Reports and export from it. See What each role can do.
Every report covers the whole Ministry fleet: everyone who can open Reports sees the same rows.
How to open it
In the sidebar, under Management, select Reports. An Open report link on a Dashboard tile also opens the report behind it, for the Dashboard's dates.
Choose a report
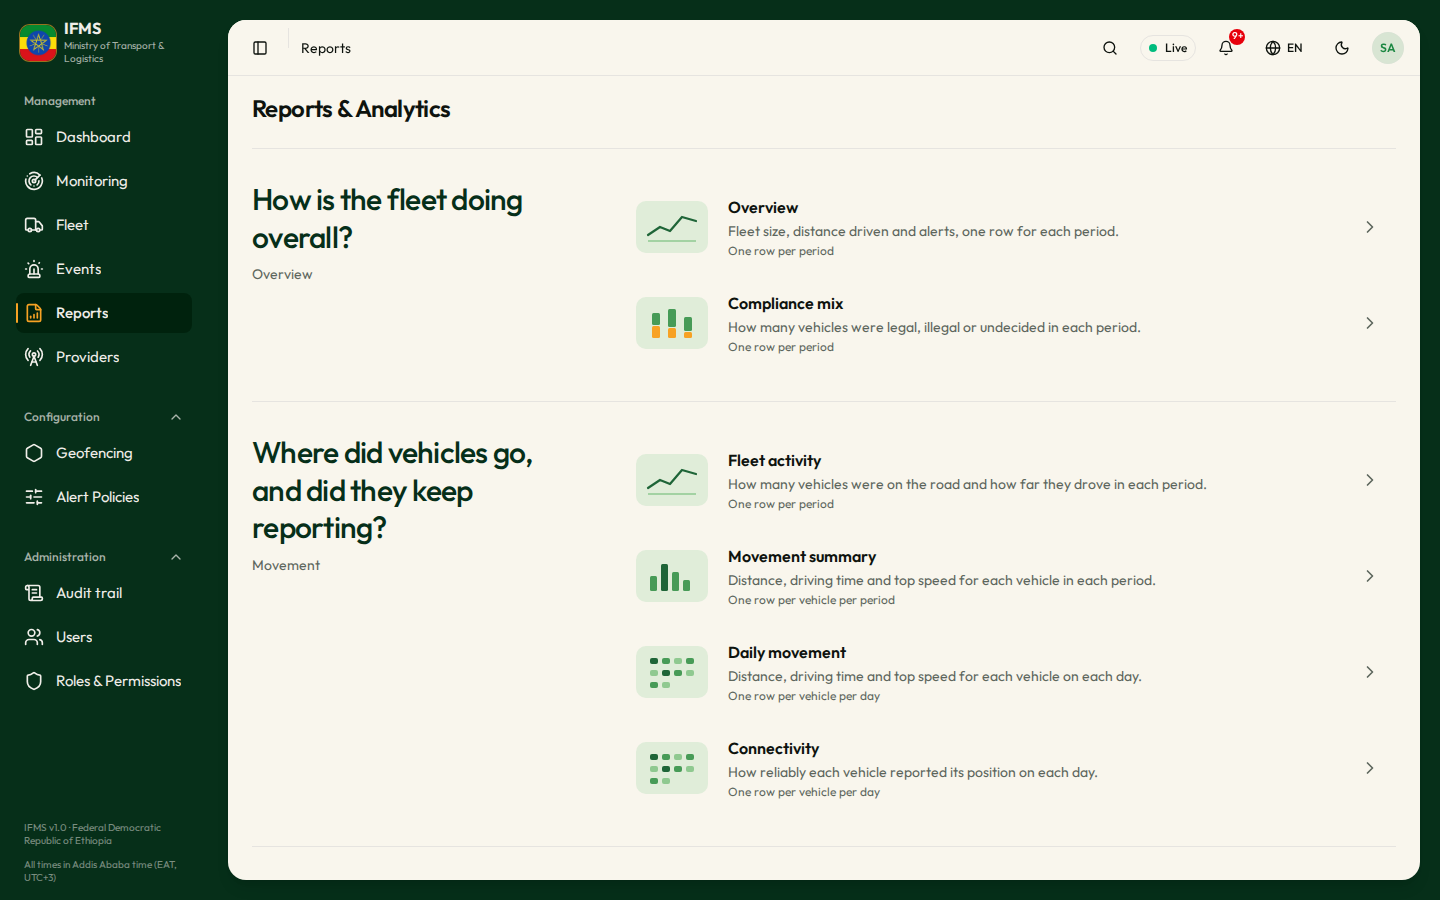
The page lists the reports under five questions. Select a report to open it.
| Question | Report | One row per |
|---|---|---|
| How is the fleet doing overall? | Overview — fleet size, distance driven and alerts. | Period |
| Compliance mix — how many vehicles were legal, illegal or undecided. | Period and legality | |
| Where did vehicles go, and did they keep reporting? | Fleet activity — how many vehicles were on the road and how far they drove. | Period, provider, operator and legality |
| Movement summary — distance, driving time and top speed for each vehicle. | Vehicle per period | |
| Daily movement — the same, for each vehicle on each day. | Vehicle per day | |
| Connectivity — how reliably each vehicle reported its position. | Vehicle per day | |
| What went wrong on the road? | Event summary — how many events of each kind were raised. | Period, provider, condition, severity and legality |
| Events — every event, with the vehicle and its status. | Event | |
| Speeding — every time a vehicle went over its speed limit. | Event | |
| Legality alerts — alerts raised when a vehicle was found not to be allowed on the road. | Alert | |
| Which vehicles visited which geozones? | Geozone activity — how many visits each geozone had. | Period and geozone |
| Geozone visits — each time a vehicle entered and left a geozone. | Visit | |
| Which vehicles are in the fleet? | Fleet register — every vehicle as it stands now. | Vehicle |
The columns of each report are listed in The reports.
Narrow a report down
The controls sit under the report's title, from left to right. Every change reloads the table at once; there is no button to press.
Choose the period
Reports that add rows up per period have Group by, From and To:
- Group by — Day, Week, Month or Year. Weeks start on Monday. Movement summary has no Day.
- From and To — the first and last day to include. Each opens a calendar with month and year menus at the top; the days you cannot pick are greyed out. From is moved back to the start of its week, month or year, so the first period is always complete.
They open on the last 30 days, by day. Movement summary opens on the last 12 weeks, by week.
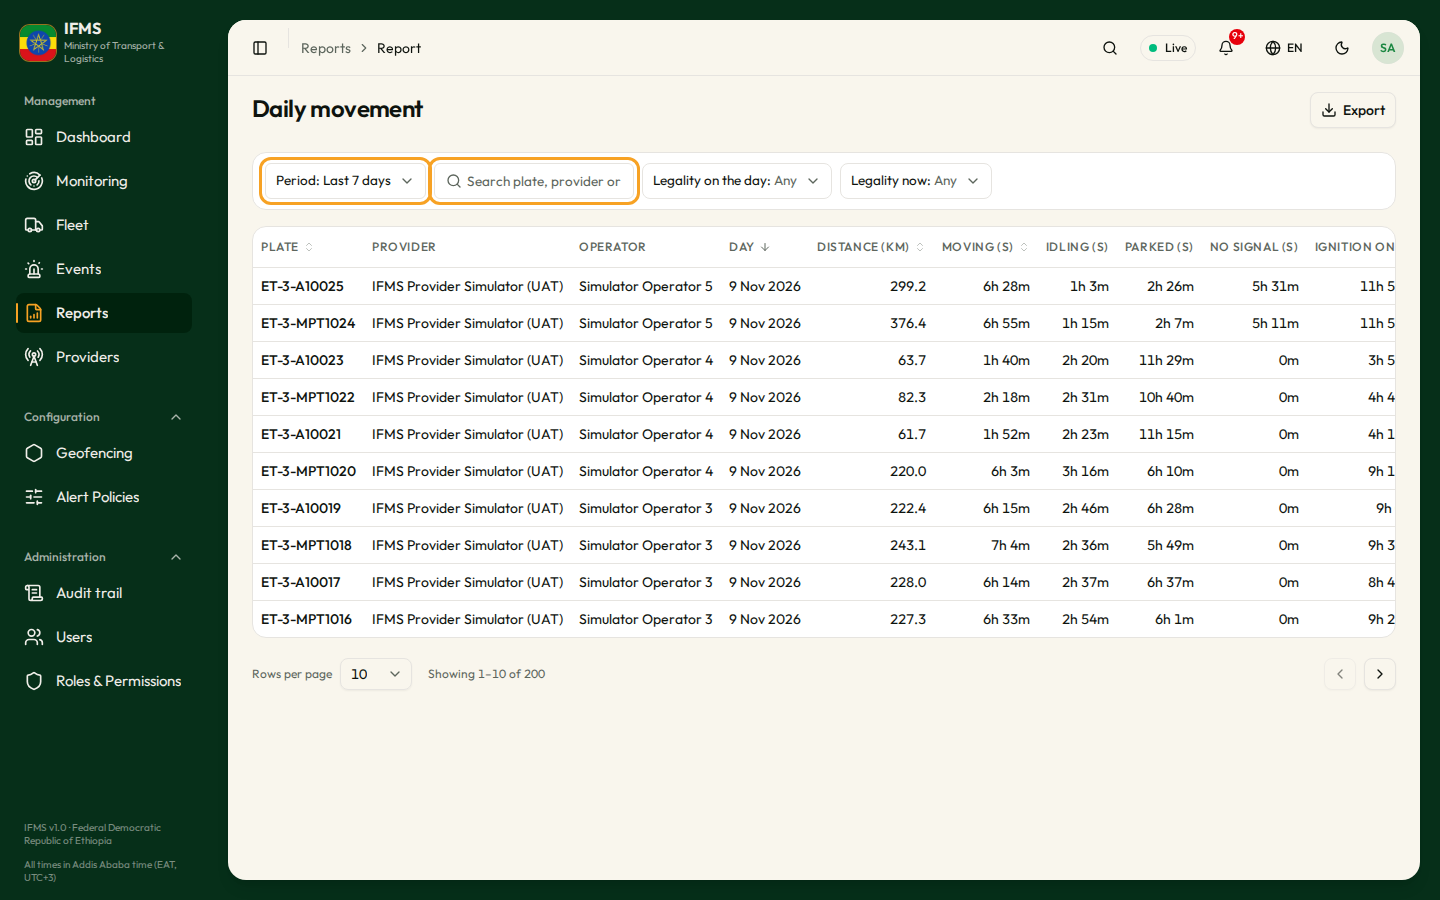
Reports that list single days, events or visits have Period instead: Today, Last 7 days, Last 30 days, This month or Custom. Custom shows From and To. They open on Last 7 days.
Choose the time of day
Events, Speeding, Legality alerts and Geozone visits list single moments, so under Custom each day also has a time:
- Select Period, then Custom.
- Pick the From day, then type a time in From time. It starts at the beginning of the day: 00:00, or 12:00 AM where your browser shows a 12-hour clock.
- Pick the To day, then type a time in To time. It starts at the end of the day: 23:59, or 11:59 PM.
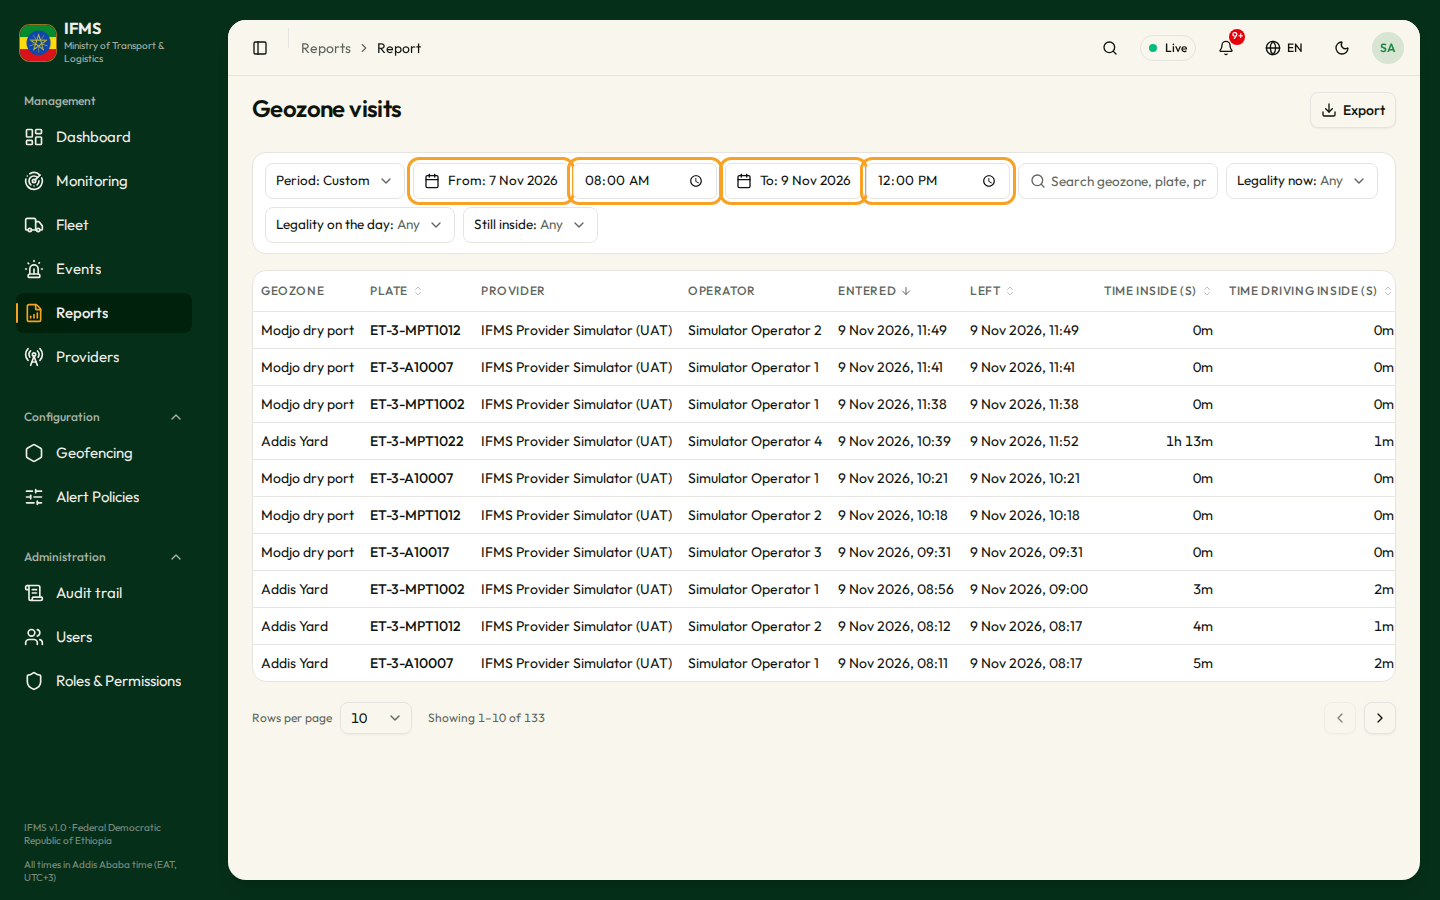
The report then starts at the From minute and ends at the end of the To minute: To time 12:00 includes a visit that started at 12:00:40. A time box stays greyed out until its day is picked. The exports use the same times.
The other reports add rows up per day, week, month or year, so they take whole days only.
Fleet register has no period: it shows the fleet as it stands now.
All days are Addis Ababa days, from midnight to midnight.
Search
Most reports have one search box. Its placeholder lists what it looks in, for example Search plate, provider or operator. Type part of a value: the search ignores upper and lower case and matches anywhere in the text.
The table updates a moment after you stop typing. A Search chip under the controls shows the term; select its ✕, or Clear all, to remove it.
Overview and Compliance mix have no search box.
Filter by legality and state
Some reports add choice buttons after the search box:
| Button | Choices |
|---|---|
| Legality on the day | Tick one or more of Legal, Illegal, the three Not checked states and Unknown. The button reads Any when nothing is ticked. |
| Legality now | The same choices, for the vehicle's decision today. |
| Still open (Events, Speeding) | Any, Yes or No. |
| Still inside (Geozone visits) | Any, Yes or No. |
See Legality in reports for what each choice means.
Read the table
-
Sort: select a column heading that can be sorted. Select it again to reverse the order. A report opens newest first; Fleet register opens on the most recently seen vehicle.
-
Open a vehicle or geozone: where a row has one, its Plate (or, in Geozone activity, its Geozone) is a link to its page.
-
Page through: Rows per page offers 10, 20, 50 and 100. Showing 1–10 of 46 says where you are, and the arrows move between pages.
-
Durations — the columns whose heading ends in (s) — are shown as 3d 2h, 2h 14m or 45m, rounded down to the minute.
-
Times are Addis Ababa time, for example 12 Jul 2026, 14:03.
-
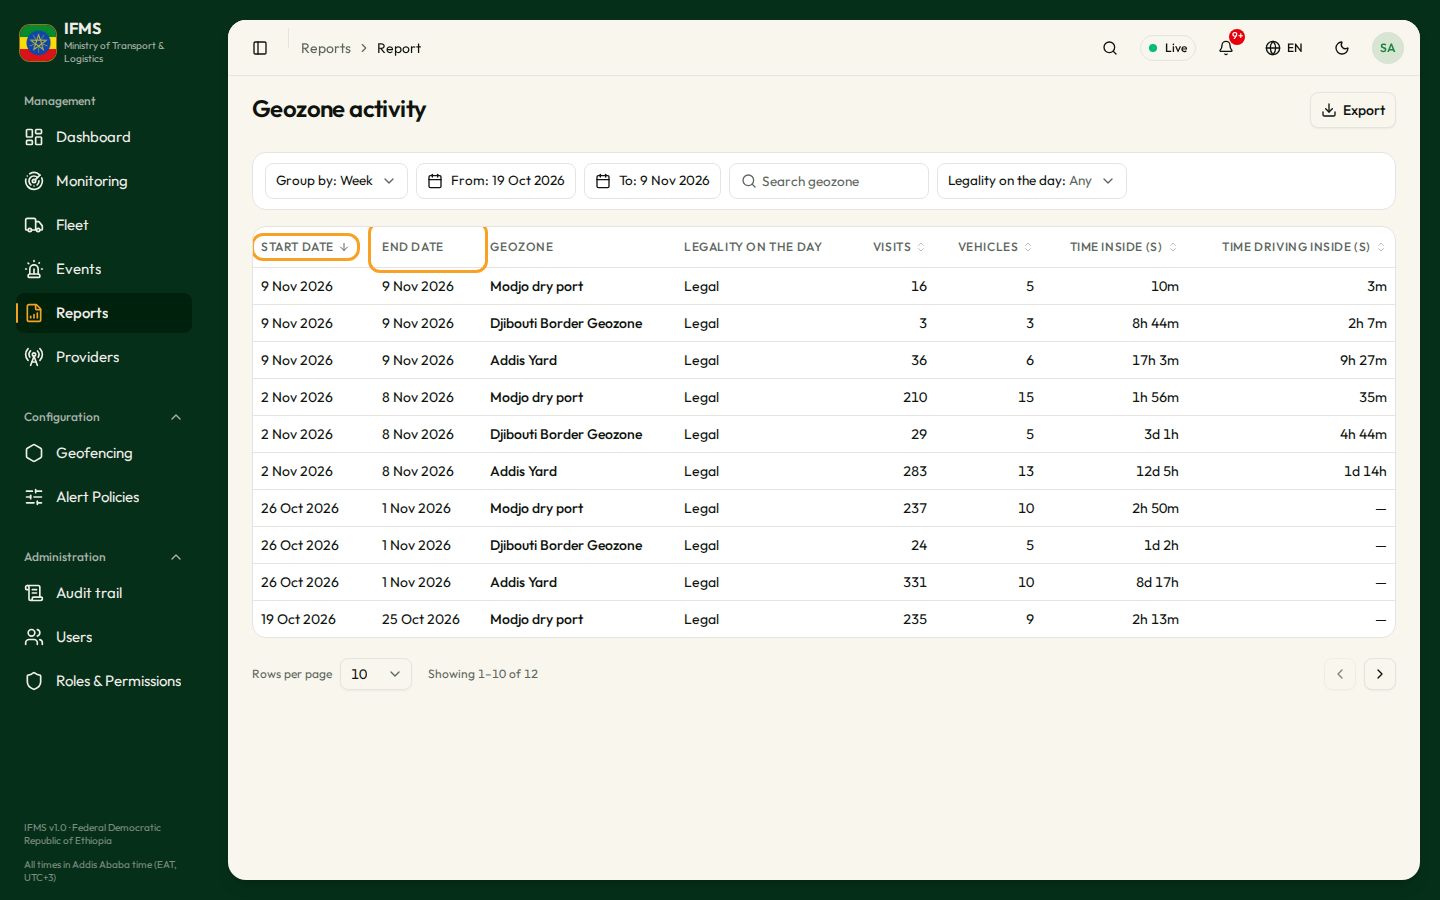
Start date and End date come first in the reports that add rows up per period: the first and last day each row covers, for example 2 Nov 2026 to 8 Nov 2026 for a week, which starts on Monday. The current week, month or year ends today.
The page address keeps the period, search, filters, sort and page. Copy it to send a colleague the same rows, or use your browser's Back button to return to your previous view.
Export a report
-
Narrow the report down until it shows the rows you want.
-
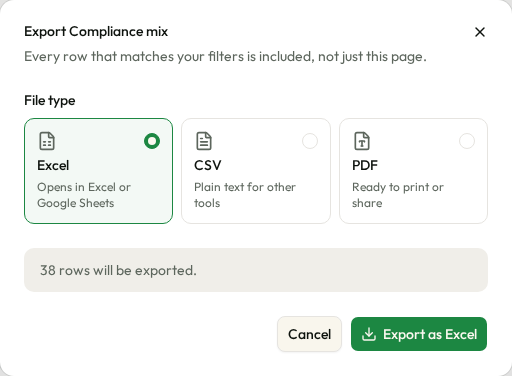
Select Export at the top right. It is greyed out while the report loads and when it has no rows.
-
Choose a File type:
Type Best for Excel Opening in Excel or Google Sheets. Chosen at first. CSV Plain text for other tools. PDF Printing or sharing. Up to 2,000 rows. The grey line underneath says how many rows the file will hold, for example 46 rows will be exported.
-
Select Export as Excel (or CSV, or PDF).
Preparing your file… shows while IFMS builds the file. The file then downloads and the window closes.
The file holds every row that matches — all pages, with your period,
search, filters and sort — not just the page on screen. It is named after the
report, for example ifms-compliance-mix-1793944111620.xlsx.
What is in each file
| Excel | CSV | ||
|---|---|---|---|
| Heading | The Ministry's flag and name, Integrated Fleet Management System, the report title and a Generated line saying when and by which account, then the column names in a green row you can filter. | Column names. | The Ministry's flag and name, Integrated Fleet Management System and the report title. Each page's footer says when the file was generated and by which account, for example Generated 09 Nov 2026 12:21 Africa/Addis_Ababa by System Administrator. |
| Dates | Days, such as Start date and End date: 2026-11-09, with no time. | The same. | The same. |
| Times | Addis Ababa time. | Not converted to Addis Ababa time. | Addis Ababa time. |
| Durations | Seconds. | Seconds. | Seconds. |
| Extra columns | Record numbers (vehicle, event, alert, geozone and operator IDs) that the screen hides. | The same. | The same. |
The PDF is printed on A4 landscape pages, numbered Page 1 of 3 and so on.
When an export cannot be made
| What you see | What it means | What to do |
|---|---|---|
| PDF greyed out, and "PDF holds up to 2,000 rows. Narrow the period or choose Excel." | The report has more than 2,000 rows. | Narrow the period or the filters, or choose Excel. |
| Every type greyed out, and "Narrow the period to export." | The report has more than 1,000,000 rows. | Narrow the period or the filters. |
| "Several exports are already running. Try again in a minute." | Too many exports are being made at once. | Wait a minute and export again. |
| A sentence about the configured maximum for a single export, or a time limit | The file would be too big, or took too long to build. | Narrow the period or the filters. |
| "That export didn't download. Try again." | The file could not be made. | Export again. If it keeps failing, tell support. |
Legality in reports
Each report row carries the IFTMS decision in up to two columns:
| Column | Meaning |
|---|---|
| Legality on the day | The decision in force when the movement, event or alert happened. |
| Legality now | The vehicle's decision today. |
| Value | What it means |
|---|---|
| Legal / Illegal | IFTMS's decision. |
| Not checked (registry miss) | IFTMS had no answer for the plate. |
| Not checked (registry out of date) | IFMS's copy of the register was too old to rely on. |
| Not checked (registry down) | IFTMS could not be reached. |
| Unknown | IFMS held no decision for the vehicle. |
Reports that add many vehicles up per period show only Legality on the day. In Fleet register, both columns show today's decision.
Things to know
- New data takes a few minutes to appear. A day's figures are rebuilt about five minutes after new positions arrive. Weekly, monthly and yearly totals follow a little later — a yearly row can be up to about half an hour behind. Today's figures keep changing until the day is over.
- Operator at the time. Each row records the operator the vehicle had when it was written, and keeps it. The Provider name is today's name for that provider.
- Episodes are recorded from the day reporting started. Events, Speeding and Event summary show nothing before then.
- Geozone changes apply from the day they are made. Earlier days keep the geozone's old shape. Time driving inside is empty for visits before it was first recorded.
When the report is empty or fails
| What you see | What it means |
|---|---|
| Grey blocks | The report is loading. |
| "No data for this period yet." / "New data appears within a few minutes." | Nothing matches the period, search and filters, or the newest data has not been taken in yet. Widen the period or clear the search. |
| "Reports are busy right now. Try again in a minute." | Many reports are being read at once. Select Try again. |
| "This report isn't available yet. Try again later." | The report is not ready on this installation. |
| "Your role can't open reports. Ask an administrator." | Your role does not allow reports. |
| "That report didn't load. Try again." | Something else went wrong. Select Try again. |
| "We couldn't find that report." with All reports | The link names a report that does not exist. |