Dashboard
The Dashboard puts the fleet's most important numbers on one page, as tiles. A few tiles show the fleet right now. The others sum up the dates you choose at the top of the page, such as the last 7 days, and are built from the same data as Reports & Analytics.
You can move, resize, add and remove tiles, and IFMS keeps your arrangement for you.
Who can see this screen
Every Ministry role can open the Dashboard and arrange its own copy. Each tile also needs its own right: a role that cannot see reports, alerts, vehicles, providers or geozones sees "Your role can't see this tile." in the tiles that use them. See What each role can do.
How to open it
In the sidebar, under Management, select Dashboard. It is the first item in the menu.
Signing in opens Monitoring, not the Dashboard. Keep a bookmark of the Dashboard if you want to start there.
The screen at a glance
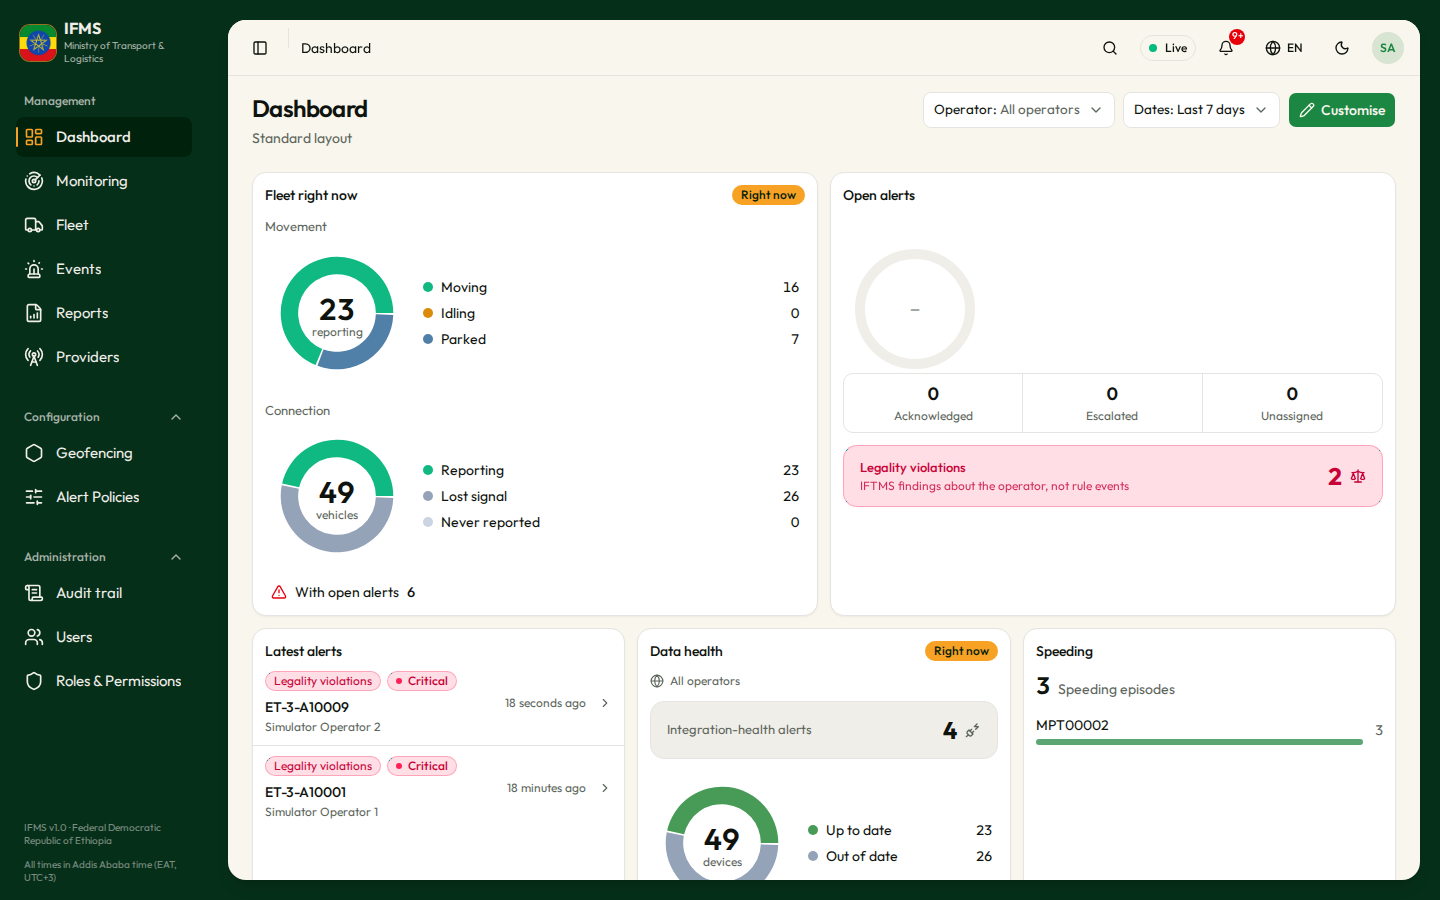
| Part | What it holds |
|---|---|
| Title | Dashboard, with a line underneath saying whose layout you are looking at: Your layout, Default for your role, or Standard layout. |
| Operator | Narrows every tile to one transport operator. All operators shows the whole fleet. |
| Dates | The days every dated tile covers. See Choose the dates. |
| Customise | Lets you rearrange the tiles. See Arrange your dashboard. |
| Tiles | One box per subject, on a grid. |
The Operator choice applies to every tile except Data health, which always shows all operators.
Choose the dates
Dates sets one period for the whole page. It offers Today, Last 7 days, Last 30 days, This month, Last month, This year and Custom. The page opens on Last 7 days.
| Choice | Days it covers |
|---|---|
| Today | Today. |
| Last 7 days | Today and the 6 days before it. |
| Last 30 days | Today and the 29 days before it. |
| This month | From the 1st of this month to today. |
| Last month | The whole of last month. |
| This year | From 1 January to today. |
| Custom | The days you pick with From and To. |
To pick your own days:
-
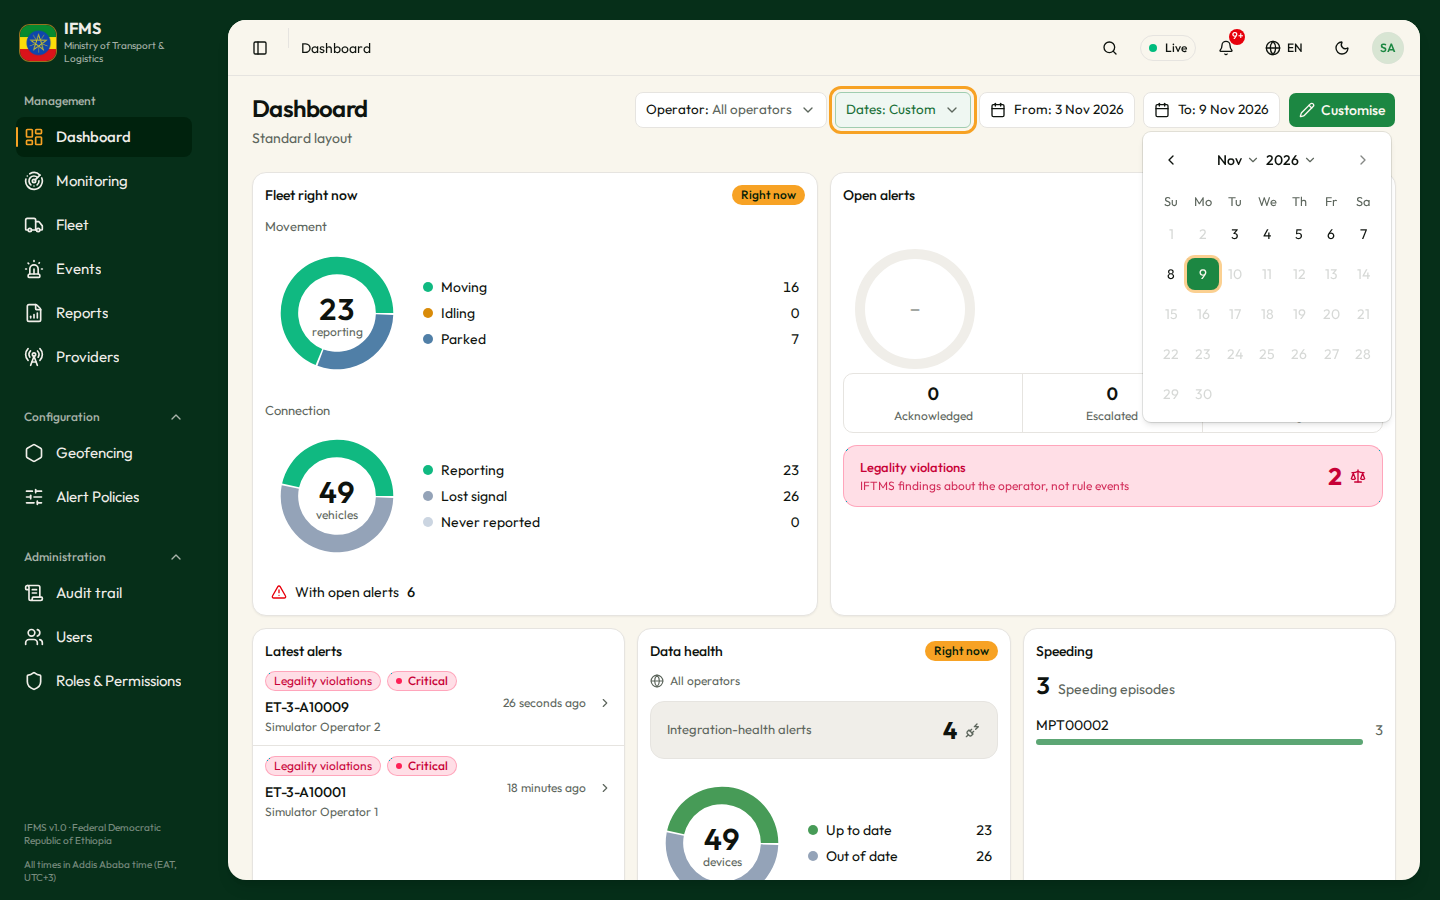
Select Dates, then Custom. From and To appear next to it, on the days you were looking at.
-
Select From and pick the first day. The month and year menus at the top of the calendar move to another month quickly.
-
Select To and pick the last day.
Each day you pick applies at once. To cannot be later than today, and a custom period can be at most 366 days long. The calendar greys out the days you cannot pick.
The choices that end today, such as Last 7 days, move on by themselves each day. All days are Addis Ababa days, from midnight to midnight, and the first and last day are both included.
The dates and the operator are kept in the page address, so a link you send to a colleague opens on the same view. They are never saved with your layout.
The current day, week and month are not finished, so their numbers keep changing while vehicles report.
Two kinds of tile
| Live tiles | Dated tiles | |
|---|---|---|
| What they show | The fleet right now. | A total, a chart or a ranking over the chosen dates. |
| How fresh | Updated as soon as something changes. | Built from the reports, which take in new data within a few minutes. |
| Right now tag | Fleet right now, Data health and Geozones now. | No. |
| Open report link | No. | Yes: opens the report behind the tile, for the same dates. |
Open alerts and Latest alerts are live, but they count only the alerts raised on the chosen dates, so they have no Right now tag.
The tiles
Live tiles
| Tile | What it shows | Selecting it |
|---|---|---|
| Fleet right now | Two ring charts. Movement splits the vehicles that are reporting into Moving, Idling and Parked. Connection splits every vehicle into Reporting, Lost signal and Never reported. Underneath, With open alerts counts the vehicles that have an open alert. | A line of either chart, or With open alerts, opens Fleet showing only those vehicles. Never reported has no link. |
| Open alerts | A ring chart of the unresolved alerts raised on the chosen dates, by severity, with the total in the middle. Underneath, three counts — Acknowledged, Escalated and Unassigned — and a separate Legality violations box for IFTMS findings about the operator. | Each part opens Events with that filter, for the same dates. |
| Latest alerts | The eight newest alerts raised on the chosen dates, with their kind, severity, plate, operator and how long ago they were raised. | A row opens that alert. |
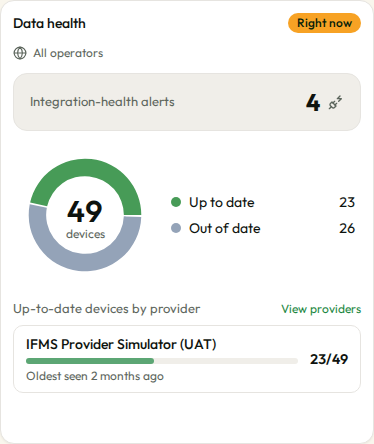
| Data health | Integration-health alerts, a ring chart of the reporting devices that are Up to date or Out of date, and Up-to-date devices by provider. | View providers opens Providers. |
| Geozones now | The eight geozones holding the most vehicles at this moment. Not on the dashboard at first: add it with Add tile. | A row opens the geozone. |
A device is Up to date when it sent a position in the last 15 minutes. Under Up-to-date devices by provider, each provider shows how many of its reporting devices are up to date, for example 23/49, and when its oldest device was last seen (Oldest seen). Providers with out-of-date devices come first.
Dated tiles
| Tile | What it shows |
|---|---|
| Speeding | The speeding episodes on the chosen dates, and the five vehicles with the most. A plate opens the vehicle's page. |
| Overview | Five numbers: the most vehicles active in a day (or week, or month, for longer periods), Distance, Legal share, Event episodes and Geozone visits. |
| Events over time | A bar chart of event episodes, with the total above it. |
| Distance travelled | A line chart of the kilometres driven, with the total above it. |
| Time spent moving | A line chart of the share of tracked time vehicles spent moving, with the overall percentage above it. |
| Legal and illegal vehicle-days | A ring chart of vehicle-days by legality, with the total in the middle and a count for each legality. |
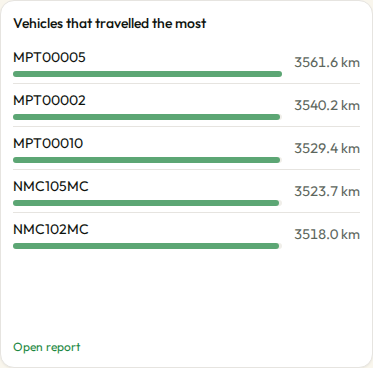
| Vehicles that travelled the most | The five plates with the most kilometres. A plate opens the vehicle's page. |
| Busiest geozones | The five geozones with the most visits. A name opens the geozone. |
| Most time without signal | The five vehicles that went longest without sending a position, in total, on the chosen dates. A plate opens the vehicle's page. |
The ranked tiles draw a bar under each row, scaled to the first one.
The charts show one point per day for up to 31 days, one per week for up to 26 weeks, and one per month beyond that.
A vehicle-day is one vehicle on one day. Legal share is the share of vehicle-days on which the vehicle was legal.
Messages in a tile
| What you see | What it means |
|---|---|
| Grey blocks | The tile is loading. |
| "No data for these dates yet." | Nothing happened on the chosen dates, or the reports have not taken in the latest data yet. |
| "Showing part of these dates." | The dates hold more rows than the tile reads, so its total covers only part of them. Use Open report for the full figures. |
| "No alerts for these dates" | Latest alerts found no alert raised on the chosen dates. |
| "Every vehicle kept its signal." | Most time without signal found no vehicle that lost its signal. |
| "Your role can't see this tile." | The tile is on your layout, but your role cannot see what it shows. Remove it, or ask an administrator. |
| "Reports are busy right now. Try again in a minute." | Many people are using reports at once. |
| "That report didn't load. Try again." | The tile could not be loaded. |
| "This list could not be loaded" with Try again | A live tile could not be loaded. Nothing is shown because the request failed, not because there is nothing to show. |
| "The dashboard didn't load" with Try again | The whole page could not be loaded. |
Arrange your dashboard
Everyone starts from a layout chosen for them. Changing it makes it Your layout, which only you see.
-
Select Customise at the top right.
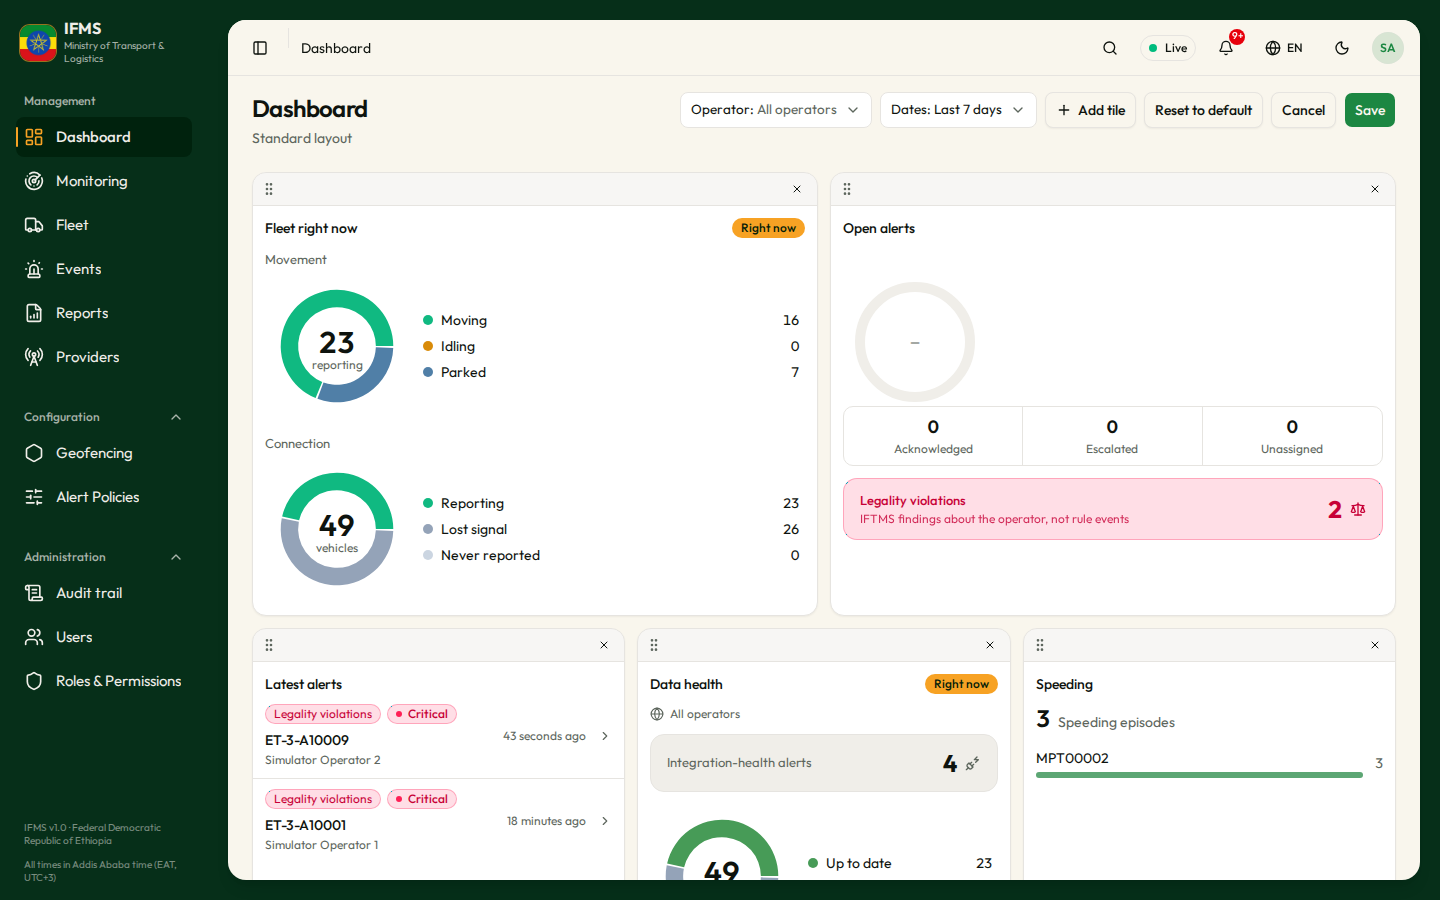
-
Change what you need:
- Move a tile: drag it by the bar at its top.
- Resize a tile: drag its edge. Each tile has a smallest size, and the tiles below move up to fill any gap.
- Remove a tile: select the X on its bar.
- Add a tile: select Add tile and choose one. It lists only tiles that are not on the page yet.
-
Select Save. "Dashboard saved." confirms it, and the line under the title reads Your layout.
Select Cancel to leave without keeping your changes.
On a screen narrower than a tablet, the tiles are shown one under the other and cannot be moved or resized; the page says "Use a wider screen to move or resize tiles."
Go back to the default
- Select Customise, then Reset to default.
- Read "Reset your dashboard?" — "Your changes are removed and you see your role's default layout again."
- Select Reset.
"Your dashboard is back to the default." confirms it.
Where your layout comes from
| Line under the title | Meaning |
|---|---|
| Your layout | You saved your own arrangement. |
| Default for your role | A layout set up for your role. |
| Standard layout | The layout IFMS ships with. |
If you saved the dashboard in another window, this page says "This dashboard changed in another window. We've loaded the latest version." and shows the newer copy.